Introduction
This is another tool which helps to mark killings, sightings, tracks and calls of the animals and generate a heatmap with these data.
I know, that is a little work, but I think it is worth. There is no need to mark each animal in each session. Just a few marks per session and within a relatively short time you got a meaningful heatmap. Of course this is also dependent on the map size and your hunting behavior.
Section Access
First you need an account to create your own heat maps. That's easy. You just have to enter a password. The password should not be easy to guess. Please memorize the password. If you forget it I can't help you because the password will be encrypted.
The password must have at least 8 characters. The following characters are allowed:
- A - Z
- a - z
- 0 - 9
- - _
Steps to create an account:
- Click the button "Access"
- Insert a password
- Click the button "New Account"
- Ready to go...
Markers
Place a mark
There are two ways to mark a position on the map.
Top left you should see at which position your mouse pointer is currently located. The numbers correspond to the EHR coordinates. So the first way to place a mark is just a click into the map. The second way is a bit more accurate:
- Click the button "Data"
- Enter the TH coordinates into the input field
- Click the button "GO"
Whichever possibility you decide, the next step is for both ways the same.
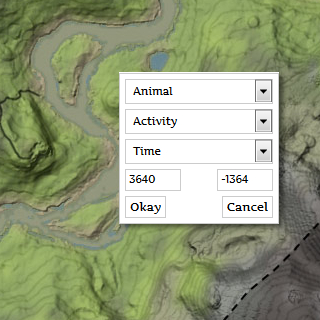
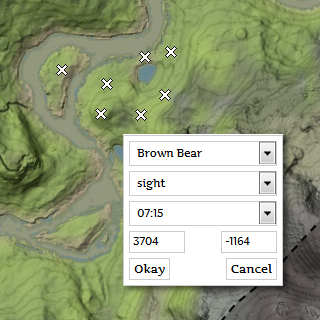
A little box pops up, and you have to make further selections. So you choose the species, the activity and the time. The position fields can't be changed.
If you are satisfied with your choices, click the "Okay" button. Then, the position will be marked with a cross, but not yet saved. So you can mark several positions, but if possible you should always save in between times.
In this manner you save your marks:
- Click the button "Data"
- Click the button "Save Data"
Delete a mark
To delete an unsaved marker you just have to click it with the right mouse button.
Maybe you want to delete a saved marker because it was inadvertently saved. You can do that like this:
- Click the button "Data"
- Click the button "Show Markers"
- Now, the original marking crosses on the map should be visible. To hide the markers click the button again.
- If you move the mouse cursor over a mark, some details will be displayed top left.
- To delete a marker, click it with the right mouse button.
Heat map
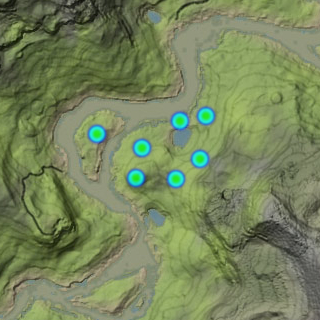
Once you've stored your markers, these are added to the heat map. Initially, the heat map consist only of individual points. The more markers added the clearer tendencies will be recognizable. Note that this also always depends on your hunting behavior.
If you move the mouse cursor over a heat map point, some details will be displayed top left.
Section Heat Options
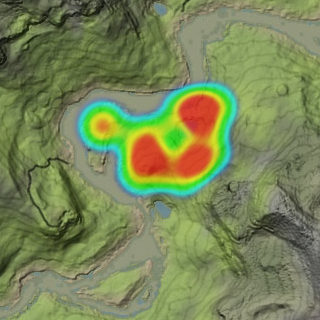
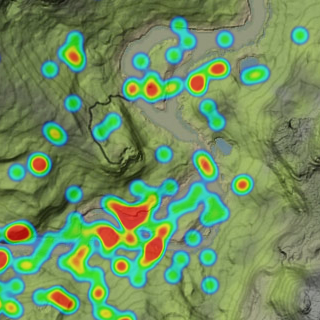
Even if you have only collected a few marks, you can make the heat map slightly nicer. Using the "Heat options" can change the appearance. Just play a little with the sliders there.
Both images here use the same data. The left image shows the heat map with the default settings. On the right side, radius and intensity were increased.
Thanks to an API called Web storage you can save the settings. If permitted by your browser the heat settings persist even after closing and re-opening the browser.
As a last option you can save the current heat map as a picture. In order to do that click the button "Get Image". After you assign a title, another button will appear at the heat options. A click on it should show you the created image.
Section Data
Load Data
The data of your heat map will not be automatically loaded after you have entered the password. You have to do the following:
- Click the button "Map"
- Choose the area you want to work with.
- Click the button "Data"
- Click the button "Load Data"
Alternatively, you can choose any filter option or you can do this:
- Click the button "Filter"
- Click the button "Reset Filter" to get all data for the selected map
Clear Data
To have a better overview, e.g. because you want to add new markers, you can clear the heat map. Data will not deleted. Possibly modified filter settings will be reset.
- Click the button "Data"
- Click the button "Clear Data"
Export Data
There are two posibilities to export your data:
- Export to Excel
- Export to CSV
Note: if you export data, the filter settings will be considered.
Delete a mark
Maybe you want to delete a marker because it was inadvertently saved. You can do that like this:
- Click the button "Data"
- Click the button "Show Markers"
- Now, the original marking crosses on the map should be visible. To hide the markers click the button again.
- If you move the mouse cursor over a mark, some details will be displayed top left.
- To delete a marker, click it with the right mouse button.
Section Filter
Once you have data loaded, the heatmap of all animal species, activities and times will be displayed. But you can filter all these options:
- Animals
- Activities
- Time Range
Using the arrow buttons you can move a selected period by 15 minutes.